Financial Highlights
Terms of Use
- • The data posted here will not immediately reflect the contents of financial statements that have been released.
- • The frequency of updates is subject to change without prior notice.
-
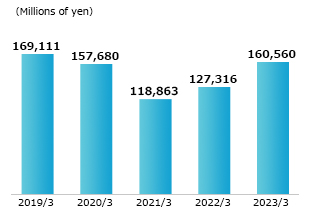
Net sales
-
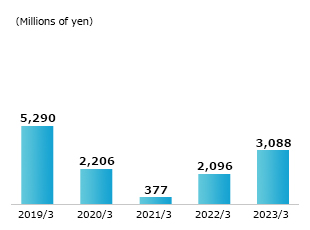
Operating income
-
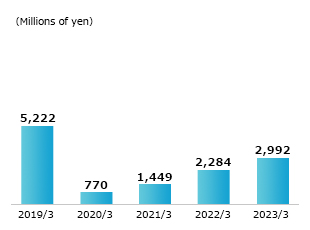
Ordinary income
-
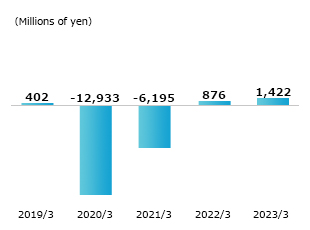
Net income
-
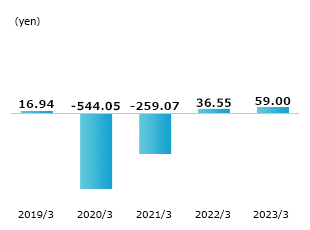
Net income per share
-
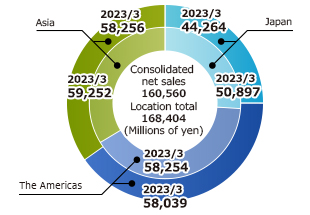
Segment net sales(2023/3)
| Fiscal year | 72th fiscal year | 73th fiscal year | 74th fiscal year | 75th fiscal year | 76th fiscal year | 77th fiscal year | 78th fiscal year |
|---|---|---|---|---|---|---|---|
| Closing month and year | March 2017 | March 2018 | March 2019 | March 2020 | March 2021 | March 2022 | March 2023 |
| Net sales (Millions of yen) |
167,723 | 171,536 | 169,111 | 157,680 | 118,863 | 127,316 | 160,560 |
| Operating income (Millions of yen) |
6,327 | 6,029 | 5,290 | 2,206 | 377 | 2,096 | 3,088 |
| Ordinary income (Millions of yen) |
6,265 | 5,648 | 5,222 | 770 | 1,449 | 2,284 | 2,992 |
| Net income (Millions of yen) |
3,980 | 2,717 | 402 | △12,933 | △6,195 | 876 | 1,422 |
| Operating Income (%) |
3.8% | 3.5% | 3.1% | 1.4% | 0.3% | 1.6% | 1.9% |
| Net income per share (EPS)(yen) |
163.73 | 114.31 | 16.94 | △544.05 | △259.07 | 36.55 | 59.00 |